You pay CloudWatch to *look* at your logs, not to keep them
There’s a line in a lot of AWS bills that makes no sense until you know how it’s priced: CloudWatch Logs Insights. People check their log storage, see a few dollars, and move on — while the real charge is somewhere else entirely.
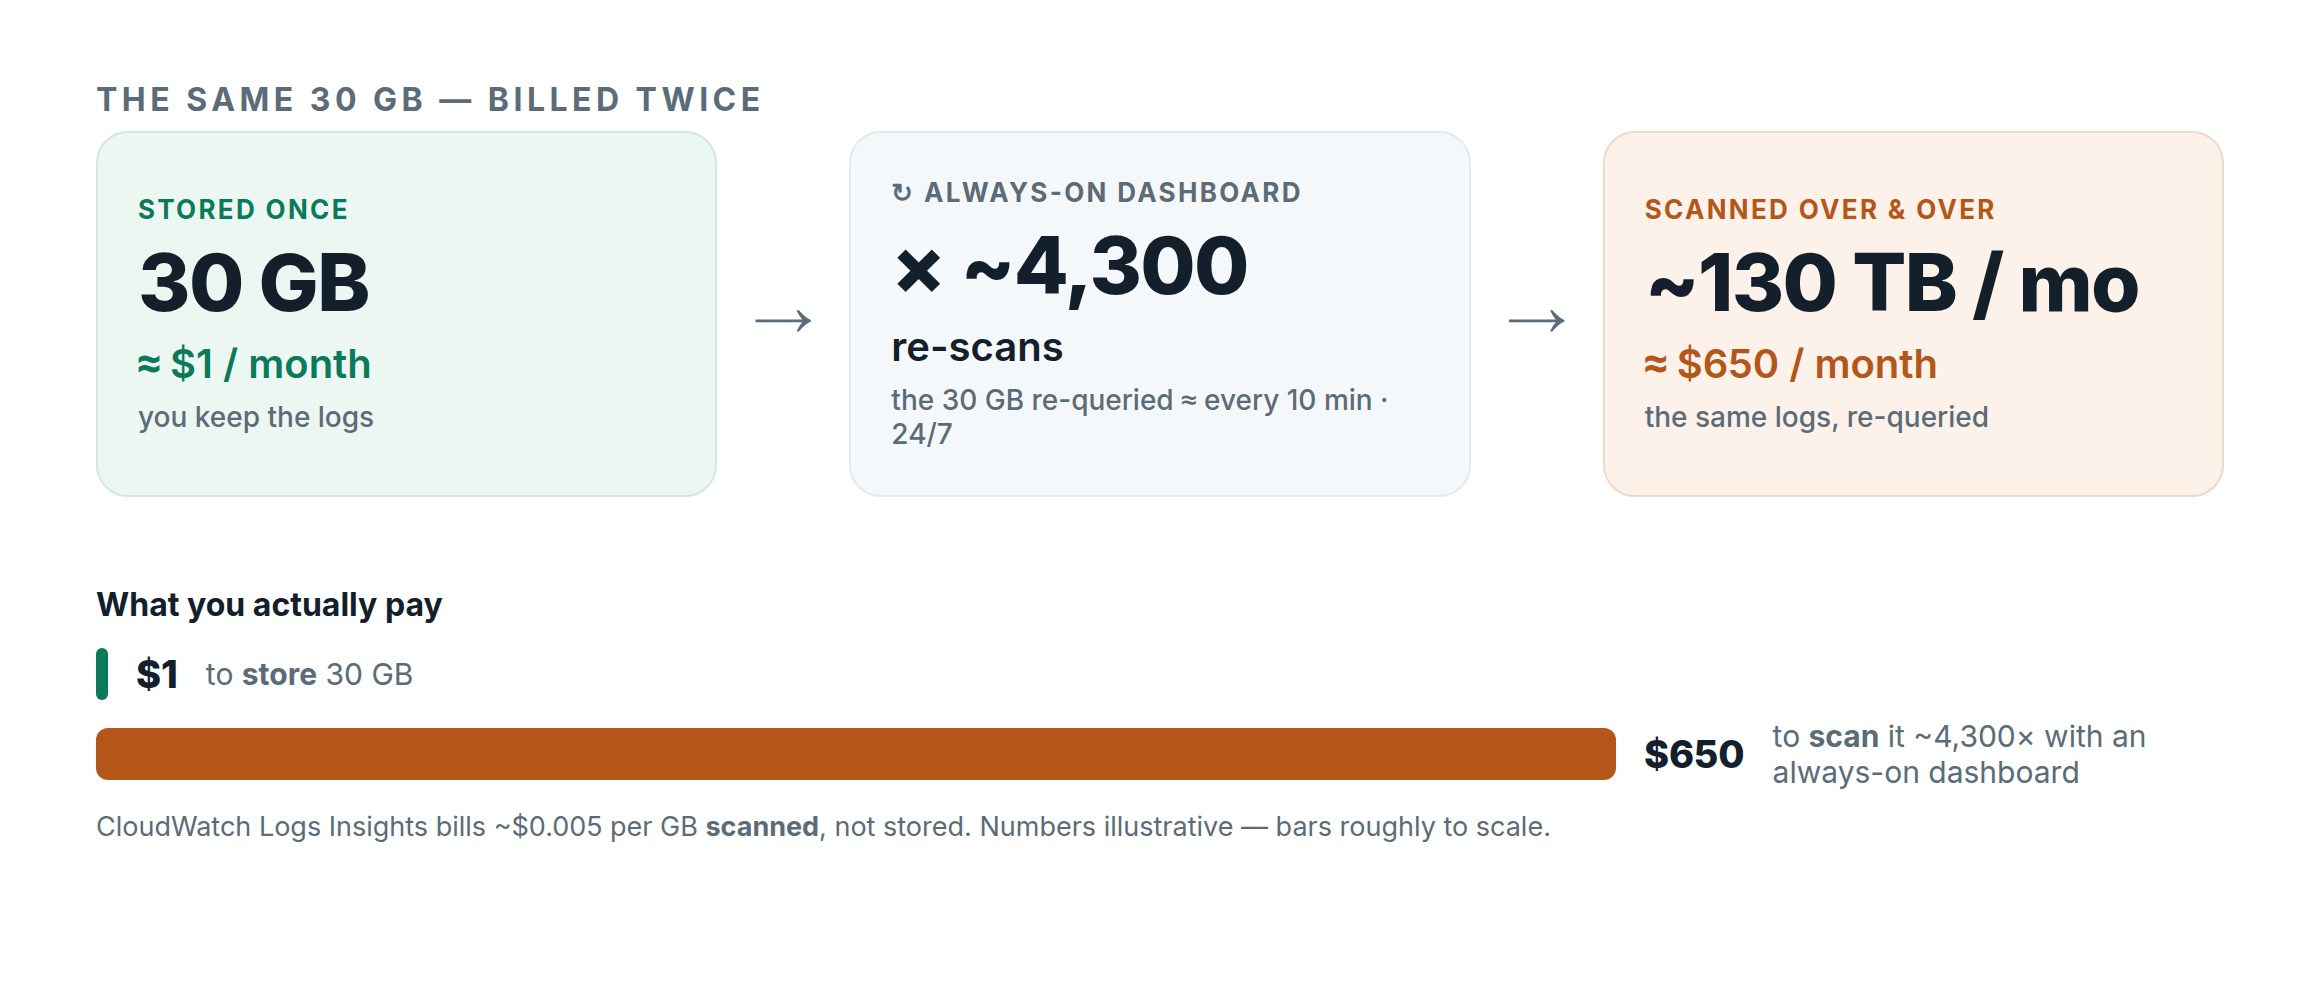
Logs Insights doesn’t bill you for the logs you keep. It bills you for the logs your queries scan — roughly $0.005 per GB scanned, every time a query runs. Storage is a rounding error; scanning is the meter.
How “storage is cheap” becomes “scanning is expensive”
Say you keep 30 GB of logs. At CloudWatch’s storage rate that’s about a dollar a month — nothing. Point a Logs Insights query at that log group and one query that scans all 30 GB costs about $0.15. Also fine.
Now put that query on a dashboard.
The always-on dashboard is a metered query loop
An operational dashboard — Grafana, or CloudWatch’s own — refreshes on a timer, and every panel re-runs its query on every refresh. The arithmetic is just $0.005 × GB scanned. Say your panels re-query a 30 GB log group so that, across all of them, it gets fully scanned about once every 10 minutes, around the clock:
- 6 scans/hour × 24 hours × 30 days = ~4,300 scans/month
- × 30 GB each = ~130 TB scanned
- × $0.005/GB = ~$650/month — to look at logs you stored for about a dollar.
It’s the meter you forgot you turned on: an always-on query loop pointed at a per-scan price. And it climbs fast — 8 panels each re-scanning that group every 5 minutes is ~2 PB and five figures a month; a tighter query window pulls it right back down. The numbers are illustrative, but the shape is real: this pattern comes up on r/aws constantly, and it’s just $0.005 × GB-scanned.
Find it on your own bill in two minutes
- Open Cost Explorer (or the CloudWatch bill) and group by usage type.
- Look for
Logs-Insights-DataScanned— the per-GB-scanned line. - Compare it to your log storage line. If DataScanned dwarfs storage, a dashboard (or a scheduled query) is re-scanning the same data on a timer.
The instinct is to audit what you store. The money is in what you scan.
The fix
- Narrow the query window. A panel that scans “the whole log group” every refresh is the worst case — scan the last 15 minutes, not everything.
- Slow the refresh. An operational dashboard rarely needs to re-scan every 30 seconds. Every few minutes is plenty, and the saving is linear.
- Stop pointing a per-scan engine at an always-on dashboard. This is the real fix. Logs Insights is excellent for ad-hoc investigation and a poor backend for a dashboard that queries 24/7. Move always-on operational dashboards to a flat-rate log store you run — Grafana + Loki (or ClickHouse / OpenSearch) on a fixed-cost box — where a dashboard that refreshes forever costs the same as one that never does. Keep CloudWatch for alerting and the occasional deep dive.
It’s the same pattern as egress: a per-unit meter that scales with your usage, not your value, next to a flat-rate alternative that doesn’t. A dashboard should be free to leave running.
If you’d like the “what am I paying to scan?” line broken out of your own bill — and an honest estimate of what a flat-rate log store would cost instead — send it to me. I’ll send back a one-page teardown within a business day.